

Structural Sub-Component Weight Groups
Parametric Plots
The
plots below show
some of the
preliminary parametrics for the sub-component weights that sum to the
Overarching Structural Group weight that have been developed from the
data
available for single engine monoplane WWII era aircraft discussed on
this website.
Caveats
Please
note
that;
- Currently
everything is still
very much a work in progress and subject to further refinement and
revision as I work to verify the data that I have currently transcribed
from the references, and as I work to collect dimensional and powering
data on the specific aircraft that I have weight data for.
- All weight
units are in pounds and power units are in Horsepower.
- For some
weight groups (such as the "Tail" group or the
"Landing Gear" group, a further subdivions of weights may be provided
for those airplanes where such data was available. As such,
rows
below the "Tail" group for the "H Tail" (Horizontal Tail) and "V Tail"
(Vertical Tail) are included for some aircraft. Similarly
rows
below the "Landing Gear" group for "Main LG" and "Tail/Nose Aux LG"
have also been added, though I may eventually separate the "Tail/Nose
Aux LG" row into a separate "Nose Aux LG" and "Tail Aux LG" row to make
it easier to differentiate these weights on the parametric plots being
developed.
- It
currently is unclear what all is included in the "Engine Section"
weight group. It appears that this includes the the engine
mounts
for allaircraft as well as cowling and cooling flaps for radial
engines. However for a few aircraft in the lists below such as the
XP-63A a very low value of 4lb is given, while for the P-63A-10 and
P-63C no value is given, leading to the suspicion that the weights of
the enine mount for those aircraft may be included elsewhere in the
weight estimate (such as in the "Fuselage" weight or "Engine
Accessories" weight groups.
- I need to
further review and
clean up the "Fuselage" and "Body" group weights to ensure that I have
correctly and consistantly recordedd this data. Specifically;
- In
Reference [1] many of the aircraft list "Fuselage" and "Engine Section"
weights separately. However for several of the F2A/B339
aircraft
variants a "Body + Landing Gear" weight and an "Engine Section" weight
is given, whereas for the XF2A-1 no separate "Engine Section" weight
appears to be given.
- In
Reference [2] only "Body" weights are listed, with no mention of
"Fuselage" or "Engine Section" weights.
- In
References [3] and [4] the "Body Group" weight is listed as including
the "Fuselage less Engine Section" and "Alighting Gear" (Landing Gear).
However, since weight data is provided for both the
"Fuselage less Engine Section" and "Alighting Gear" in addition to the
total "Body Group" weight it is fairly easy to re-align these weights
to match the format used in other references if necessary.
However, eventhough the "Fuselage less Engine Section" is
called
out as a weight group I cannot find anywhere in these references where
the "Engine Section" is accounted for. As such, I am
currently
still reviewing the weight from these two references and have not yet
incorporated them into the plots below.
- In
Reference [5] the "Body Group" weight and "Landing Gear" weights are
listed separately.
As such, it appears that the
most consistent use of terminology would be to;
- Treat the
"Body Group" as being the sum of the "Fuselage" and "Engine Section
Groups"
- Investigate
the weights of the "Alighting Gear" (Landing Gear) separately, where
possible
- Also
dosome analyses of "Body" weight plus "Landing Gear" weight to see how
the F2A/B339 variants listedin Reference [1] compare to the other
aircraft that there is data on.
Beyond this I also
intend to continue to review the information provided in References [3]
and [4].
Structural
Weight Sub-Components
As
noted on
the General
Weight
Summary Format page,
the overarching Structural Weight Group is equal to
the sum of the;
- Alighting/Landing
Gear Group
Wing Group
The
first plot below show the relationship of Wing Weight to Total
Wing
Area. As shown in this plot a number of the naval aircraft
designs have folding wings.
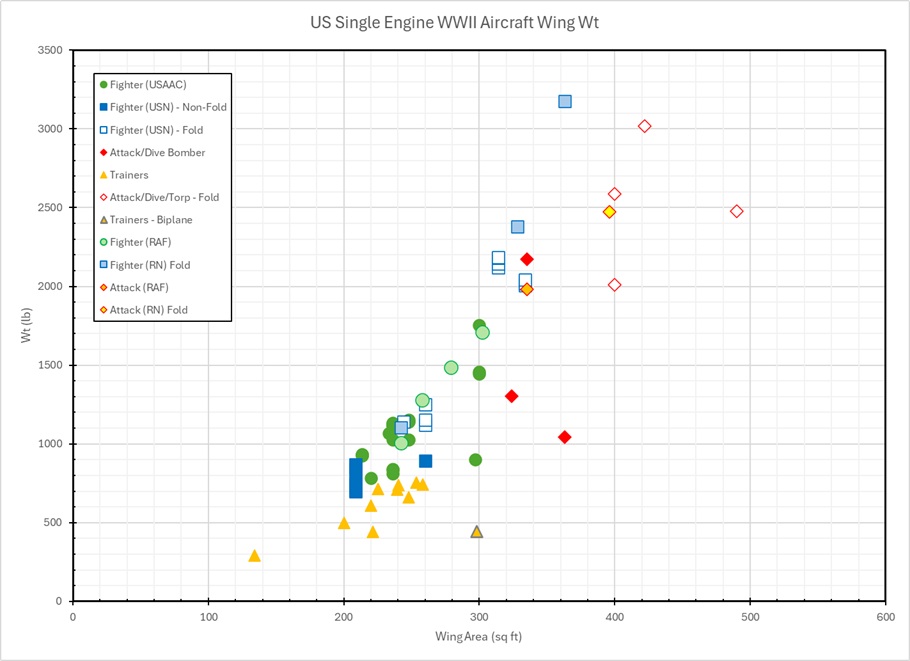
I am
currently working to try and
develop more detailed plots to better help identify the impact that
incorporating the ability to fold has on the overall weight of a wing.
In addition, in reviewing Wing Weight equations for other
aircraft type it can be seen that there are several other factors other
than just Wing Area which are expected to impact the overall wing
weight, including such factors as;
- Wing Area
- Weight of
Fuel Carried in the Wings
- Wing
Aspect Ratio
- Wing
Sweep Angle
- Wing
Taper Ratio
- Wing
Thickness to Chord Ratio
- Ultimate
Load Factor
- Aircraft
Design Gross Weight
- Dynamic
Pressure - which is a factor of the aircraft's speed
In the
paper "A Review of Aircraft Wing Mass Estimation Methods" by Odeh
Dababneh amd Timoleon Kipouros [Reference 19], a figure is provided for more modern
aircraft plotting Wing Weight versus a parameter equal to;
The Aircraft's
Gross Weight * Ultimate Load Factor (in G's) * Wing Span * Gross Wing
Area / Wing Thickness @ the Root
Plotting the weight information available for WWII era Aircraft against
the same parameter (assuming
pounds for weight and feet or feet squared for the other dimension, as
appropriate) results
in the plots shown below, where the first graph shows the data on a
log-log scale and the second plot shows the data on normal X and y
scales.


In these graphs please note that aircraft with fixed wings are shown as
solid symbols while those with white centers represent aircraft with
foldable wings. As shown in these figures although there is some
scattter the fixed wing data shows a reasonable fit (R2=
0.9043) with the data
for aircraft showing a slightly weaker fit (R2=
0.7708). However, it should be noted that some assumptions were
made in the data. Specifically;for aircraft where
- a Design Weight and
Ultimate load Factor was available those were used
- a Design Weight was
not known, the Basic Gross Mission Weight was used
- the Root Thickness
was known that was used, but where it was not known it was estimated
from the Root Chord Length and nominal Root t/c data
- the Ultimate Load
Factor is known for one variant, it was assumed to be the same for
other variant
Additionally,
for the Brewster 239/XF2A-1 Prototypes, where a Normal Design Load
Factor of 9 G's is known and a ration of Ultimate to Yeild Strngth of
1.35 is also provided, the Ultimate Load Factor was assumed to by 12.15
G's (or 1.35 * 9 G's).
Some concerns here are that;
- It is not fully clear that Design Weight and Basic Gross Mission Weight are the same
- the nominal Root t/c listed for a
given airfoil may be rounded to the nearest %, and as such Root Chord *
Root (t/c) may vary by a small amount from the actualnominal Root Wing
Thickness
- It is
possible that for diffeertnet variants of an aiurcraft that the
Ultimate Load Factor may be reduced as the aircraft weight increases.
With respect to the Ultimate Load Factors for different variants of an
aircraft, it is noted that in Ref X for the Curtiss Hawk H-75A when
fitted with a Curtiss Wright Cyclone Engine having a Basic Gross
Mission Weight o 5562lb is listed as having an Ultimate Load Factor of
12 G's, while the dsame design, but fitted with a Pratt & Whitney
Twin Wasp engine and having a Basic Gross Mission Weight of 5792lb is
listed as having an Ultimate Load Factor of 11.5 G's (where 5562lb * 12
G's ~= 5792lb * 11.5 G's).
Folding Wings
With respect to folding wings, NASA Report N81-23068 "Aircraft
Wing Weight Build-Up Methodology With Modification for Materials and
Construction Techniques" by Peter York and Raymond W. Labell dated
September 1980 [Reference 20], provides the follwing formula for
estimating the weight penalty for folding (or pivoting) wings based on
post WWII aircraft;
Wt Penalty = 0.03386 * (B * n) *^ 0.2477 * (Sw) ^ 1.244 * ( 1 - b'/b) ^ 1.307 * Kws
where;
B = Maximum Clean Gross Weight or nlaximum Zero Wing Fuel
Weight
(lb)
Less:
Wing Croup
Wing
Fael (Amount in above gross weight)
Main landing gear if in the wing
Nacelle Group if in the wing
Propulsion Group if engines are in the wing
Electrical Group if engines are in the wing
Oil and Unusuable Fuel if engines are in the wing
n = Ultimate load factor at FDGW (for maneuver)
Sw = Wing Area (sq ft)
b' = Folded wing span or pivot span for variable sweep (ft)
b = Wing Span (ft)
Kws = 1.0 for Folding Wings or 0.556 for Variable Sweep Wings
Additionally the paper "The
method of the folding wing’s design and mass
optimization for the naval aircrafts" by Yarygina Maria Viktorovna
of the Moscow Aviation Institute [Reference 21] provides a method for
estimating the weight impact of fitting folding wings on modern Russian
naval aircraft, and the presentation "Mass Estimation of Folding Wings"
by Dieter Scholz
Vladimir Zhuravlev
Hamburg University of Applied Sciences
Moscow Aviation Institute [Reference 22] provides a re-analysis of this
data to develop an estimation method based on the transverse location
of the wing fold mechanism along the wing span, providing the following
equation;
Relative Mass Increase = mfold =
mins + mmech,fold + mmech,pin
=-0.659 y/(b/2) + 0.659
For
reference, based on the data I currently have available for the fixed
wing F4F-3, and the folding wing F4F-4 and FM-2 varaints of the Wildcat
fighter, the fold mechanism for the F4F-4 and FM-2 appears to be at a
half-span of approximately 51 in from centerline while the overall
half-span of the wing is 228 inches, for a y/(b/2) of 22.4%.
Based on the equation from Reference 20 the estimated weight penalty
for folding wings for the Wildcat type figher would be 380 to 395 lb
(or a 42-44% increase).
Based on the equation from Reference 22 the estimated weight penalty
for folding wings for a Wildcat type fighter would be 51% (or about 450
to 460 lb increase).
Based on the weight data available for the F4F-3, F4F-4/Martlet I/FM-1
and the FM-2 the actual weight increase between the F4F-3 and the
FF4F-4/Martlet I/FM-1 would be between 225 to 340lb (or a 25 to 39%
increase
) while the increase from an F4F-3 to the FM-2 would be 260 to 272 lb (or about 29 to 31%).
It appears that the equations from References 20 and 22 likely include
the weight of hydraulics that may be fitted on more modern aircraft but
which was not present on the WWII era Wildcat fighters, which may
represent some of the wdifference in the estimated weights. A
review of Reference 21 indicates that the weight of the hydraulic
actuators.
Trainer Aircraft
Unfotunately
in the above wing weight re-analysis, I was not able to include the
infromation that I have available on trainer aircraft, due in part to
the limited information that I currently have available on the ultimate
load factors they were designed to. As such, I have plotted those
weights against wing area to try and develop a simpler estimate for
their weights, as shown in the plot below. In these plots I have
included the Soviet Post WWII era Yake-11 and the US WWII era Biplane
PT-13A only for reference, and they were not used to develop the trend
lines shown. As shown in the first plot most of the data for the
US WWII era monoplane trainers fall reasonably closely to the trend
line, with the largest outlier ppearing to the the AT-19. Of
note, all the trainers listed escept the AT-19 were two-seat low-wing
aircraft, primarily used for training pilots and air gunners, while the
AT-19 was a high-wing 3 seat aircraft primarily used for training
observers and navigators. As such, AT-19 has some notable
differences from the other trainer aircraft shown. The second
plot below shows a revised trend line for only the two-seat aircraft
with the other data points removed for cllarity.


Tail Group
The
next three plots
show the
relationship of Total Tail Weight to Total Tail Area, Horizontal Tail
Weight to Horizontal Tail Area, and Vertical Tail Weight to Vertical
TailArea, respectively.


Body Group
These
last few plots show "Body Group" weight versus both "Basic Mission
Gross Weight" and "Body Length". In reviewing the data
though, it
is not clear what the "Body Length" reported in Reference [2]
specifically relates to. Specifically for radial engined
aircraft
it looks like it may actually only address to length of the aircraft
aft of the fire wall, and not include the length of the cowling.
As such I intend to further review these values and may
eventually replace the plot below with a plot of "Body Weight" versus
"Total Aircraft Length". Also along these lines, since there
appears to be some degree of scatter in the plot of "Body" weight verse
"Body Length" I may look to trying to also incorporate "Body Width"and
"Body Depth" into the analyses since the weight of a very deep fuselage
or a very narrow fuselage may be expected to vary a fair bit from other
aircraft of similar lengths.


Landing Gear Group
The
next three plots show the Total Landing Gear Weight, the Main Landing
Gear Weight, and the Nose/Tail Landing Gear Weight as a function of the
Basic Mission Gross Weight of the aircraft analysed.


Due to the
scatter in the above plots I decided to try and develop more detailed
estimation methods for both the main and auxiliary landing gear
weights. For the auxiliary landing gear I separated the data
first into those with nose mounted auxiliary landing gear (such as the
P-39 and P-63) and those with tail mounted landing gear (which included
the rest of the aircraft that I currently have data for).
Due to the limited data that I currently have for aircraft with
tricycle type landing gear I have not yet been able to develop curves
or trend lines for the weight of the nose gear for those type aircraft.
For tsil dragging aircraft I seoarated the data into a number of broad
categories depending on if the tail wheels were fixed (in the down
position), semi-retractable, fully retractable, and fully retractable
with hinged doors enclosing them when retracted. and replotted the data
as shown below.

As shown in the figure above much of the data falls relatively closely
to three curves, with the aircraft with "Fixed" tail wheels falling
along the lower (Blue) curve. Next, the aircraft with steerable
tail wheels fixed in the down position and those with retractable
landing gear (but not separate hinged doors) all appear to fall along
the middle (Orange) curve. And finally, the aircraft with
retractable tail wheels and hinged doors, appear to fall mostly along
the upper (Purple) curve.
In geeneral I am still working to verify all the information but the
aircraft with fixed landing gear that I have data on includes;
- F4F-3 & F4F-4
- SBD
- SB2C
- A-25
- Yak-11
The aircraft with fixed but steerable tail wheels includes;
The aircraft with retractable tail wheel (but not hinged doors) includes;
- P-36
- P-40
- XBT2D/AD-7
- Brewster F2A & early 239
- F6F
- F8F
- TBM
And finally, the aircraft with retractable tail wheels and hinged doors includes;

[Source: Ref 8 (as annotated by this site)]
It should
be noted that all this data has not yet been fully verified as some
naval aircraft could either be fitted with hard rubber, retractable
wheels for use on carriers but also be retrofitted with larger
inflatable, non-retractable tail wheels when operated from land, and it
is not always fully clear which configuration the available weight data
represents. In addition for land based versions of carrier
capable aircraft types, it is not fully clear if all the retractable
mechanisms and equipment was removed from these land based variants or
whether only the wheels, tires and related bottom end support structure
was altered (to potentially allow for a quick revision back to a
smaller hard rubber retractable wheel if necessary.
For the main landing gear I have attempted to collect data to relate
these weights not just to an aircraft's Basic Mission Gross Weight but
also the length of the main landing gear strut/mechanism (from its upper
attachment point to the aircraft's structure to the main wheel axle (as shown below), as
well as the main landing gear wheel diameter.

[Source: Ref 16 (P-51 Dwg 102-33001)]
With this data I
performed a regression analysis in Excel for the land based aircraft
and the naval aircraft spearately. The graph below shows a plot
of the estimated main landing gear weight for the aircraft analysed
versus the actual weights. In general this graph shows a little
bit of scatter but overall appears to show a pretty good level of
agreement.

The equations developed from these regression analyses are as follows;
Land Aircraft:
Mn Landing Gear Wt (lb) = -175.002 + 0.023254 * BMGW + 12.62256 * MLG-Length + 1.262165 * MLG Tire Diameter
Naval Aircraft:
Mn Landing Gear Wt (lb) = -1242.26 + 0.013049 * BMGW + 6.093593 * MLG-Length + 42.56083 * MLG Tire Diameter
Notes:
This website
has been developed with a number of low cost or free programs including
Hot Metal Pro, KompoZer, Microsoft
Designer and Da Button
Factory.com
Rev 5-11-26